Is it Better to Buy or Rent?
Several years ago, I wrote an article in which I suggested that if you intended to be in the same location for 4 or more years that economically it made more sense to buy a home, rather than rent. The article garnered a fair deal of attention as well as many questions and comments both pro and con.
Since first the original article (2012) was first published; home values in the Research Triangle {Chapel Hill, Durham, Raleigh and surrounding area} have risen roughly 30% and rental rates have also risen by approximately 20%; however, mortgage rates are actually lower now than then.
Given the changes in the market; it seemed like a good time to revisit the numbers to find out whether the original conclusion that buying made more financial sense was still valid.
Low inventory continues to drive prices higher and the consensus is that this will continue to be the case over the next 3-5 years as North Carolina in general and the Research Triangle area in specific continue to be in-bound areas, with more people moving in than out. Over the past couple of years this area has grown by approximately 100 people a day. While the spreadsheet below doesn’t factor this in, I think it’s important to note; as growth combined with low inventory always generates positive appreciation in value.
In addition, please note that I do not factor in any “tax benefits” which still (at present time) exist. In our example below a house costing $200,000 is likely to generate between $6,000 - $9,000 in tax savings over our four-year period depending on your specific tax bracket.
Renting vs Buying: A Look At The Numbers
Let’s start with renting as this is straightforward. Currently a decent 3-bedroom 2 bath home is renting in the range of $1700+/- a month. As is always the case rental rates vary by location, school district and other factors but then so do purchase prices. Based on data taken from the Triangle MLS, Zillow, Realtor.com and other sources $1700 seems to be a realistic estimate. So, $1700 times 48 equals $81,600 or the amount renting will cost you for four years after which you’re done, you walk away and your money is gone.
Now let’s look at Buying and consider a variety of possible scenarios. The market remains stable after four years, the market goes down and the homes value depreciates by 10%. The market goes down and the homes sells for 5% less. The market remains stable and the house sells for the same price you purchased it and lastly the market goes up by 10% which is only about one third the appreciation homes have seen in our market in the past 4 years. This is easiest to view in the spreadsheet below: In my example I use 5% down, but FHA loans allow for 3% down, and there are programs available for 0% down. I choose 5% as this is what Fannie Mae reports the average first time home buyer using as a down payment in 2017.
Sample Rent Versus Buy Chart
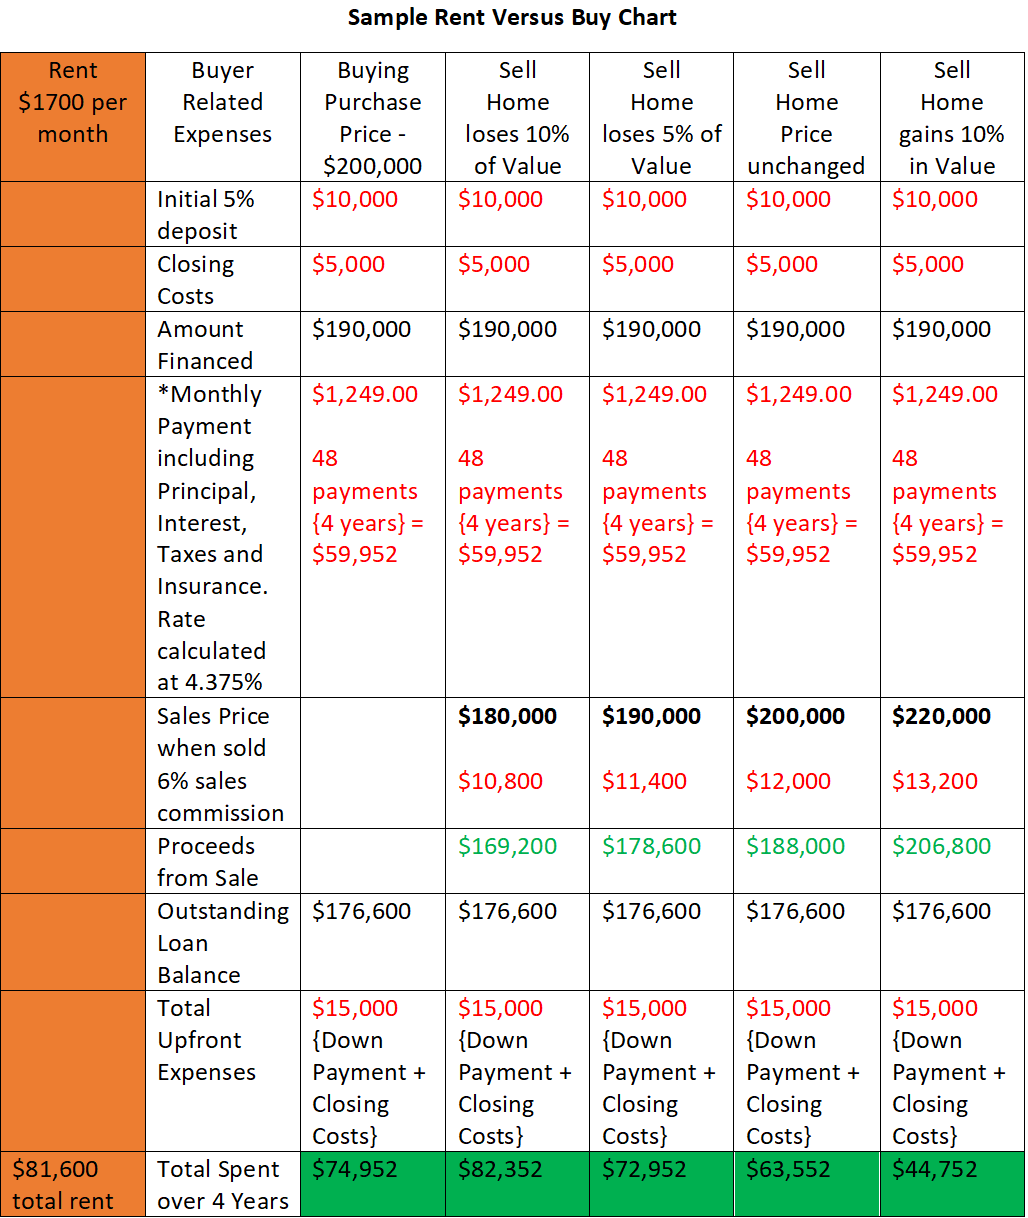
*Rates vary depending on credit scores and other factors. Currently they are about 4% however with 5% down a borrower will most often have to pay Private Mortgage Insurance or PMI. This can be avoided in most cases by paying a ¼% higher interest rate and for most buyers who are statistically unlikely to own the house more than 7 years. (There’s only a 7% chance that you will remain in your first home longer than this) Paying the extra ¼% interest rate is less expensive than carrying PMI. Check with your lender to confirm rates and options.
What the chart above indicates to me is that except for the market dropping 10% in value from the time you purchase a home to the time you sell the home four years later; in which case you end up spending roughly $750 more than had you simply rented; in every case it ultimately costs less to buy than rent.
So, Should You Rent or Buy in Durham, Cary, and Chapel Hill?
No one at My NC Homes can predict the future, but we do have the advantage of decades of experience and market data that we can draw on to advise our buyer clients. When preparing the above chart, it was done very specifically to present what we feel is a somewhat pessimistic view of the market. Since we first published a similar chart our buyer clients have in almost every instance done even better than we suggested as homes have appreciated between 20-30%. The starter home market which is what this chart focuses on has seen the most appreciation overall and I think it’s a safe bet that this will continue to be the case.
If you’re thinking of buying a home here in the Chapel Hill, Durham, Raleigh area and have questions, we encourage you to contact us, we’re happy to sit down with you to answer them. We promise you’ll walk away knowing a lot more than when you first sat down and that there will be absolutely no pressure to sign anything. We are committed to giving our clients the information they need to make smart, informed decisions and in never pressuring our clients to do anything they don’t feel good about doing.
Posted by Larry Tollen on
Leave A Comment